Like most of the Ruby community, we were pretty excited by the move to generational garbage collection in Ruby 2.1. The new approach promised for shorter GC pauses and better overall performance, and for most of us, it seems to be living up to that promise. But there are still some serious flaws with the way that memory is managed in Ruby, and you should be aware of these flaws if you’re running any sort of server process – particularly if that server is ever creating large objects (like, say, strings). These flaws make it not just possible, but likely that your servers will gobble up RAM, and will lead to out-of-memory conditions. And currently, the only solutions are workarounds – hacks that you need to know about.
The land of the bloated unicorns
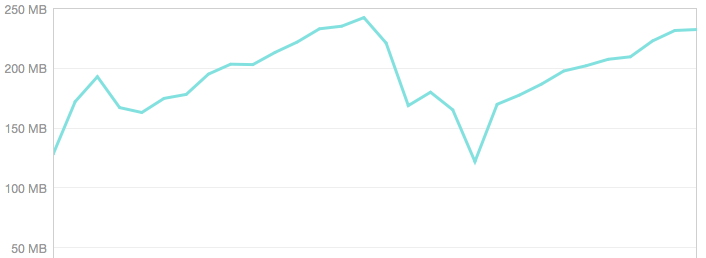
We discovered this when we were trying to debug a runtime memory leak in our servers that was periodically leading to crashes while serving production traffic. We’d restart the server, and watch helplessly as the memory usage graph climbed steadily, until the Unicorn would bloat up, then crash and burn:

Unicorn weight watchers
One of the nice features of newer versions of Ruby is the ObjectSpace class which, among other things, gives you the ability to account for memory usage by data type. We used this, along with the GC.stat method, to add some basic memory diagnostics to our request logs (more on this in a later post).
After a bit of poking around, we were able to narrow down the culprit for our leak: for various reasons that I won’t go into here, our document requests load some pre-rendered HTML content from disk, and then insert that content into the page layout. In pseudo-code, it looks something like this:
def show_doc
  @doc = load_doc_from_disk(@doc_key)
  render_not_found and return unless @doc
end
We load a doc, we render the doc, we throw the doc away. So where’s the leak?
Where do you hide a bloated unicorn?
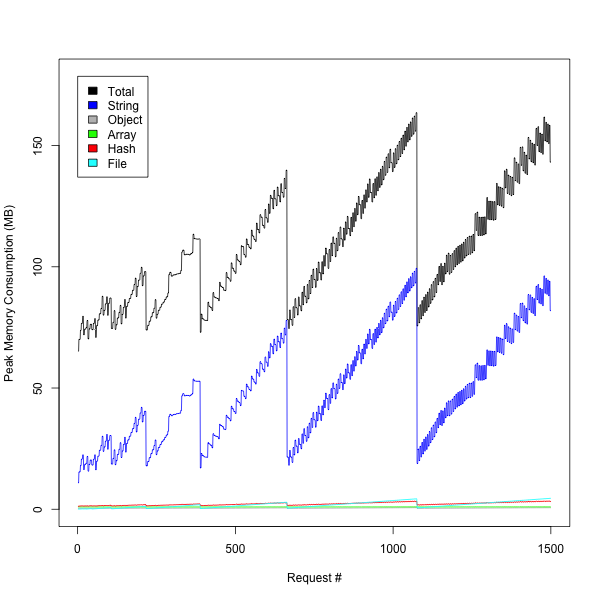
We noticed two main things when we looked at the data: first, String allocation is the vast majority of our memory usage. Not terribly surprising for a webserver:

But hey…what about that ridiculously spikey graph? In this test, we’re simply loading the same document again and again, so there should be little variation. And why is the total memory usage so much higher than can be explained from the sum of the memory usage of the different types? Hmmm…
The plot (and the unicorn) thickens
Here’s where the story dives into some of the deeper, darker corners of
the MRI interpreter. One of the important things that you should know about Ruby
strings (and many other objects, like Arrays) is that once they get past a Certain
Size (in MRI-speak, that’s RSTRING_EMBED_LEN_MAX), they’re
stored on the system heap,
via plain ol’ malloc (eventually…there are a few macros involved):
static VALUE
str_new(VALUE klass, const char *ptr, long len)
{
  VALUE str;

  /* ... irrelevant code omitted ... */

  str = str_alloc(klass);
  if (len > RSTRING_EMBED_LEN_MAX) {
    RSTRING(str)->as.heap.aux.capa = len;

    /* allocation happens here: */
    RSTRING(str)->as.heap.ptr = ALLOC_N(char,len+1);
    STR_SET_NOEMBED(str);
  }

  /* ... more code omitted ... */
}
What happens when those long strings are garbage collected? The memory they manage
is freed using calls to the C free method (again, eventually…there are a few
macros involved):
void
rb_str_free(VALUE str)
{
  if (!STR_EMBED_P(str) && !STR_SHARED_P(str)) {
    /* this eventually gets turned into a call to free()... */
    xfree(RSTRING(str)->as.heap.ptr);
  }
}
And when does this happen? Well, those deallocations only happen when Ruby starts cleaning up objects, and that only happens when the garbage collector starts a sweep. But here’s where it gets hairy: the whole point of generational GC in Ruby 2.1 was to minimize the number of objects that get marked for collection, by introducing the notion of “new” and “old” objects – essentially, the garbage collector saves time by only marking a subset of allocated objects, and puts off the deallocation of “old” generation objects until a major collection occurs.
So when does a major collection happen? Now we’re at the crux of the issue: major collections only happen when the Ruby heap (i.e. the data structure that holds all the object references) gets big enough to trigger one (currently, an adjustable value that starts at 16MB, and grows with the heap). But the size of the allocated objects doesn’t play a role – if you allocate a big string and it makes it to the “old” generation, it could hang around your process for a long time.
That’s some bad news, right there. It means that it’s trivial to trigger wild memory swings in a ruby process with code that might otherwise seem harmless:
while true
  "a" * (1024 ** 2)
end
Run this for long enough, and you’ll see your Ruby process consume more and more memory, in ever-wider swings (I let it gobble up over 2GB on my system before I killed it). But don’t take my word for it: ask Koichi Sasada, the author of the generational GC in Ruby 2.1:
“Some ‘short-lived’ young objects will be promoted to ‘old-gen’ accidentally….if such ‘short-lived’ objects consume huge memory we need to free such objects.”
also:
“We cannot measure how oldgen objects consume [memory collectively]….a few oldgen objects can grab huge memory”
His slides on the generational GC (warning: PDF file) are a must-read, if you haven’t already.
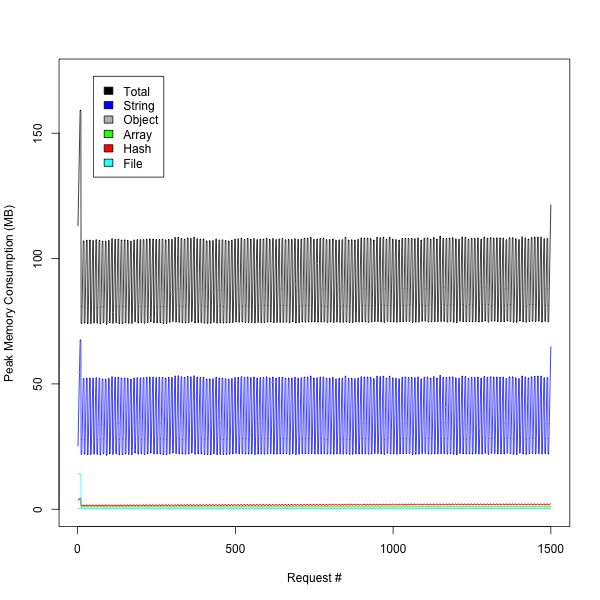
A huge part of Ruby memory management is essentially out of control of the garbage collector, and those blobs of object-allocated memory can stick around your process for a long time. Kirk Haines of Engine Yard went into detail about this problem in his fantastic post from 2010, and most everything he talks about still applies today. The GC algorithms in Ruby 2.1 actually make the problem worse, by delaying major collections. We verified this in our app by making a call to GC.start after every request to our leaking action. The result? Memory usage that’s as flat as a pancake:

Sending your fattened unicorns to market
I can’t emphasize how big a bummer this is for users of Ruby in production: if you have any code that ever allocates a large String, Array, Hash etc., then you’re essentially out of luck when it comes to assurances that your processes won’t run out of memory. Your choices are: explicitly run a garbage collection after every suspicious call (slow, resource intensive), or wait for your processes to bloat up, and reap them when they get too big (really slow, random, bad for users).
(This is the TL;DR Section)
So, what do we do now? At the moment, there are few practical options. You can use something like Unicorn::OobGC to try to run garbage collection after the completion of every user request. This works, but it’s overkill, and worse, it requires you to turn off garbage collection. This exposes your process to all sorts of badness, because with GC disabled, trivial code can really be problematic:
GC.disable; 100_000_000.times { "" } # boom
You can also try to be slightly nicer than using something like monit to just randomly slaughter your running processes. Using the unicorn-worker-killer will automatically kill off your bloated unicorns, but only after they’re done serving user traffic. This is a reasonable compromise, but again, it’s still possible that your unicorns will wander off the ranch during a request, leading to random, unrecoverable failures. That’s bad for users, and it’s bad for you.
The svelte unicorns of the future
But it’s not all bad news. The Ruby core developers are aware of the problem, and there are some changes (3GenGC, oldgen space estimation) being tested which may bring relief. But right now, for users of Ruby 2.1, this is a very real problem that could easily affect you in production.
What did we do? We used a combination of Unicorn::OobGC and unicorn-worker-killer to help tame our herds of dumpy animals (you are using Unicorn, right? You should be!) But it’s not an optimal solution, and there’s always the risk that something will spiral out of control.
It’s a dangerous world out there, folks. Keep an eye out for big, angry unicorns.